This free e-Learning course highlights the new features and enhancements in vRealize Operations Manager 6.0. It also presents use cases that describe how the new features align with customer needs.
At the end of this course, you should be able to:
Describe the VMware Cloud Management platform.
Explain the new and enhanced features of vRealize Operations Manager 6.0.
Explain the architecture of vRealize Operations Manager 6.0.
Describe the vRealize Operations Manager 6.0 management packs.
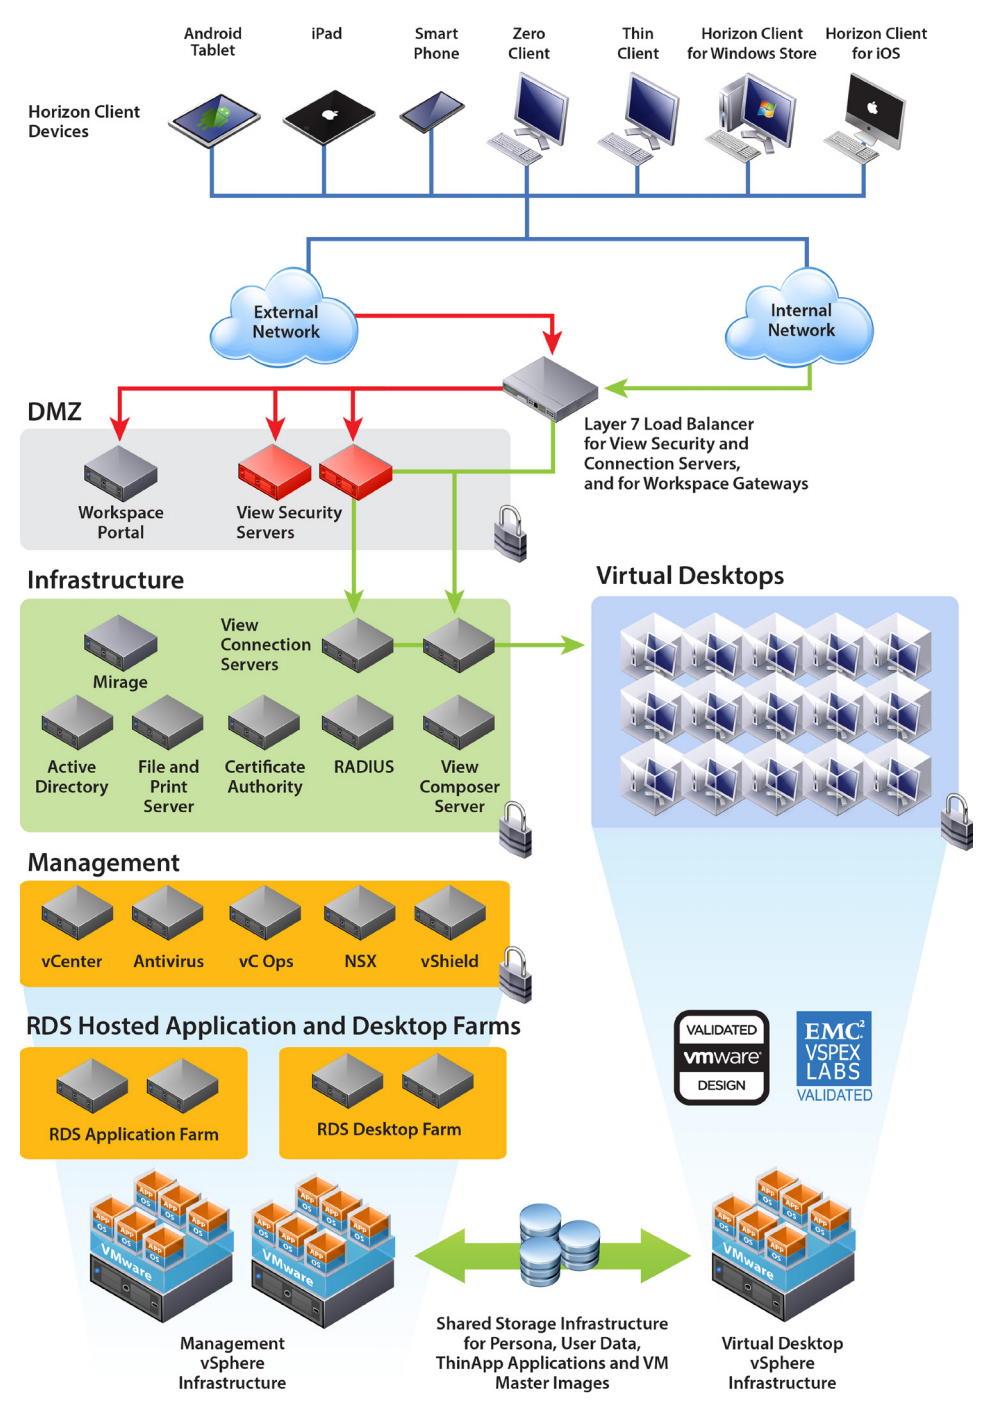
The VMware vCenter Operations Management Suite for VMware Horizon 6 with View provides new desktop-specific features and benefits, such as application and in-guest performance metrics, for even more precise diagnosis of poor end-user performance. In addition, this release leverages the new VMware vCenter Operations Manager platform, which supports a “single-pane-of-glass” enterprise monitoring and diagnostic console (desktop, server, and adapters).
This video shows why you would want to manage your BCAs in vCenter Operations Manager and the value of bringing in "extra" party data. We will walk through a common degraded health scenario and talk about how you could use the dashboards and the data to solve a real problem with an application.
Kris Walsh, VMware Systems Engineer discusses VMware vCenter Operations Manager Dashboard and Capacity Planning specifically the settings and their meanings.
You can customize your vCenter Operations Manager workspace to meet your specific needs. Depending on your access rights, you can add, delete, and arrange widgets on your dashboards, create new dashboards, import or export dashboards from other instances, edit widget configuration options, and configure widget interactions. You typically create a dashboard by selecting a dashboard template. A dashboard template contains all of the information in a dashboard definition. You can also create a dashboard by defining and arranging the widgets that the dashboard contains. vCenter Operations Manager includes predefined dashboard templates. If the predefined templates do not meet your needs, you can create your own templates. A widget is a pane on a dashboard that contains information about configured attributes, resources, applications, or the overall processes in your environment. Widgets can provide a holistic, end-to-end view of the health of all of the applications in your enterprise. If your user account has the necessary access rights, you can add and remove widgets from your dashboards. You add a widget to a dashboard by editing the dashboard. You can add any widget to any dashboard. A dashboard typically contains widgets that show related information, such as different views of the performance of a particular group of resources or similar alerts for separate applications.
In this video you will see the integration of Log Insight with the vCenter Operations Management platform. VMware vCenter Operations Manager 5.7.1 introduces integration with vCenter Log Insight (GA available in Q3 2013) and the vCenter Web Cleint. Log Insight can be configured to send alerts to vCenter Operations Manager about vCenter Server objects. In the vSphere UI, vCenter Operations displays links to launch Log Insight in-context from the alerts details page and from the objects details page.
Integration of Log Insight with the vCenter Operations Management platform extends operational visibility and proactive management capabilities across infrastructure and applications in a dynamic, hybrid cloud environment. Integration also helps you maximize ROI and value by bringing unstructured data (such as syslog files) together with structured data (such as metrics and key performance indicators), offering a significantly enhanced solution for end-to-end operations management.
vCenter Operations Manager 5.7.1 is the latest release of VMware's integrated operations suite, converging performance, capacity, and configuration management. This new release introduces the following features and enhancements.
Performance Report Pack
This release introduces new performance report pack. By default, reports now include operations status report for line of business virtual machines, alert and performance trend, cluster utilization trend, average and peak virtual machine storage latency. With these reports you can get a consolidated operational status for a group of virtual machines and identify the clusters, datastores, or virtual machines have had performance problems. You can assess any impact to performance in terms of performance or health degradation, as well as determine which datastores had performance problems for the given time and identify the impacted virtual machines from a given datastore. For more information about the new performance reports, see the topic "Reporting Tools in vCenter Operations Manager" in the VMware vCenter Operations Manager Online Help.
Launch in Context
vCenter Operations Manager is enhanced to offer in-context application launch capability. Using this feature, you can configure a button or menu item to launch an external application using a URL in a specific context defined by the active UI element and selected object. For example, you can add an "Open in" drop-down menu that launches the vCenter Web user interface, navigating to the details of a selected virtual machine. In the same menu, there might be other items that launch into Hyperic or Log Insight for the same virtual machine.
vCenter Log Insight Integration
This release introduces integration with vCenter Log Insight (GA available in Q3 2013) and vCenter Operations Manager. Log Insight can be configured to send alerts to vCenter Operations Manager about vCenter Server objects. In the vSphere UI, vCenter Operations displays links to launch Log Insight in-context from the alerts details page and from the objects details page.
vSphere Dashboards in the Custom UI
The vSphere group in the Dashboards menu contains several default dashboards for managing virtual objects in a vSphere environment. These default dashboards are available to all members of the Administrators, Operators, and Users user groups. This release introduces the following default vSphere dashboards:
Troubleshooting Dashboard
VM Utilization Dashboard
VM Performance Dashboard
Host Utilization Dashboard
Cluster Utilization Dashboard
Datastore Performance Dashboard
Datastore Space Dashboard
Heatmaps Dashboard
Alerts Dashboard
Host Memory Dashboard
This video will show you some of the new features and how to upgrade to version 5.7.1. This procedure is applicable when updating to vCenter Operations Manager 5.7.1 vApp from the following product versions. vCenter Operations Manager 5.0, 5.0.1, 5.0.2, 5.0.3, 5.6, and 5.7.1, including any Hotfix versions.