Monday, December 22. 2008
SearchMyVM 2.0 Now Available
CompareMyVM Launched
Veeam Monitor 3.0.2 | First Findings
The download seemed to take forever and after the first 30 MB it stalled. It took more than two hours to receive the full 100 MB. Finally I installed Veeam Monitor with the local SQL2005 Express database. I tried to monitor a vSphere server but after the initial connection, it greyed out. Adding an ESX 3.5U3 server succeeded. I could even add my VC server. The tool looks great and has a feature I didn’t see before. Veeam implemented the remote console ActiveX object. I tried out some features like generating a report and alarm modelling. Everything works great, good job Veeam.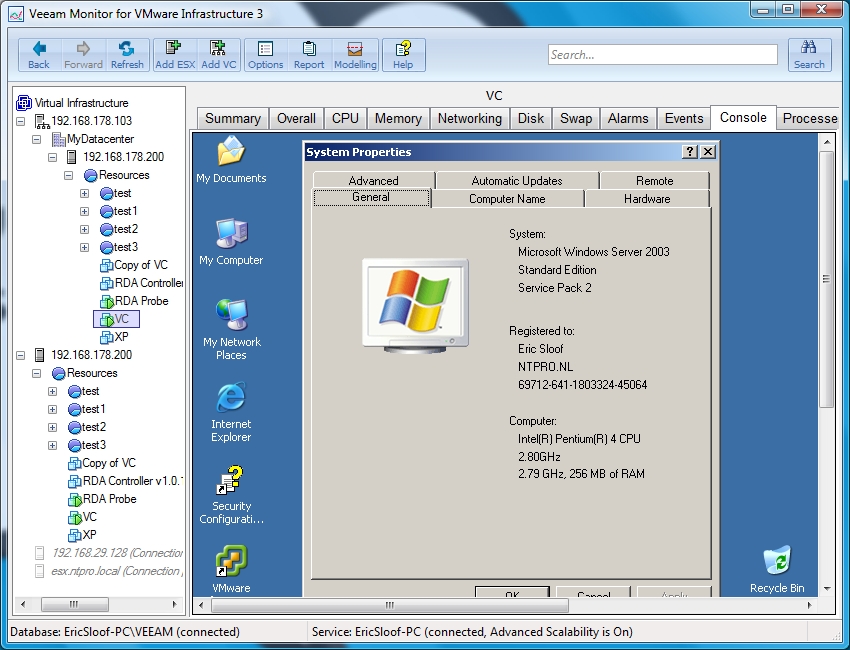
Veeam Monitor 3.0.2 features a new functionality mode which is automatically enabled when you install the product without a license, of if your license expires. Veeam Monitor Free Edition has the following limitations compared to the full version.
- Performance history lookup is limited to 24
- Number of alarms is limited to 10
- Performance and trend reporting is disabled
- Alarm modelling is disabled
Here's your free gift from Veeam!
Veeam is pleased to announce a new free version of Veeam Monitor. The Veeam Monitor Free Edition is an easy-to-use VMware monitoring solution designed to meet the day-to-day needs of VMware administrators who need real-time performance monitoring and alerting. Built from the ground up specifically for the virtual world, Veeam Monitor provides a bird’s-eye view of key performance metrics across your virtual ESXi infrastructure.
With Veeam Monitor, you can view real-time resource usage data for any virtual infrastructure object or collection of objects, as well as known infrastructure events, all on a single screen. This allows you to finally see your virtual infrastructure as a unified entity, not just a collection of isolated hosts and guests.

Saturday, December 20. 2008
vSphere management with PowerGUI | First findings
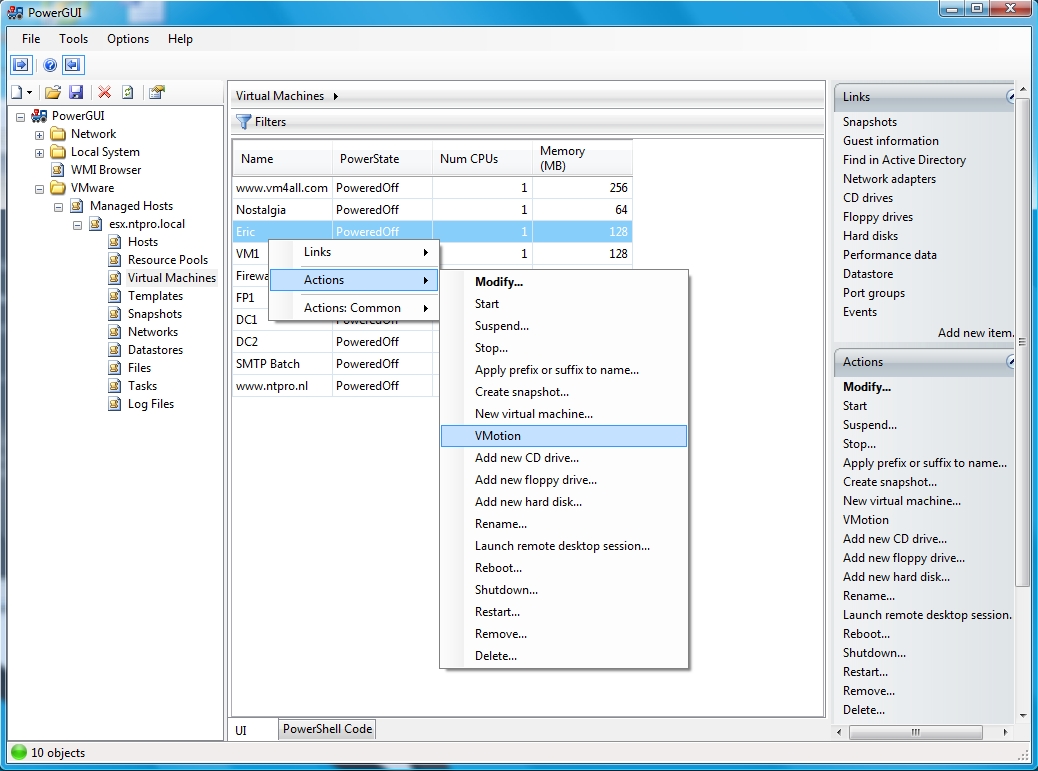 After last night’s launch, I’ve downloaded and imported the new version of PowerGUI’s VMware Infrastructure Management PowerPack. Upgrading and importing of the PowerPack goes straight forward. Many elements in the three are completely restructured, it really rocks and it’s also vSphere compatible. Here’s a screenshot of my vSphere server running on Workstation 6.5.1 managed by PowerGUI. :-)
Friday, December 19. 2008
Rich Brambley unwrapped Veeam's holiday gift
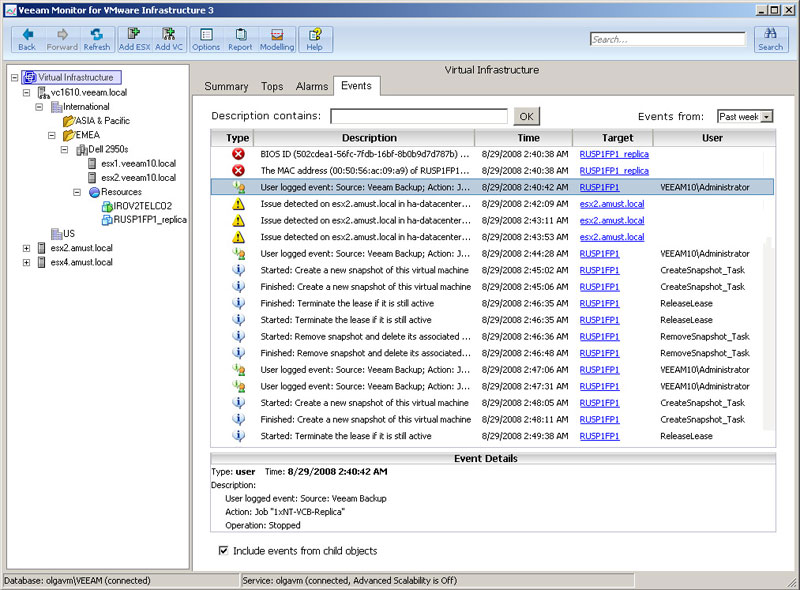 Rich Brambley over at VM/ETC did some great research, he found out what Veeam’s Christmas holiday gift will be. It’s Veeam’s Monitor 3.0, a tool for performance monitoring, capacity planning and troubleshooting for your entire VMware Infrastructure Veeam Monitor is an easy to deploy, framework-independent VMware monitoring solution that was created expressly to help you better manage the health and performance of your VMware Infrastructure 3 (VI3) environment. Veeam Monitor provides support for troubleshooting and issue resolution, as well as trend reporting and capacity planning - equipping you to proactively manage ESX / ESXi infrastructure system health and performance today and over the long term.
 Veeam will be unveiling a new free tool is on Dec. 22 – everyone who registers will automatically receive a download link that day via e-mail. This holiday gift is marked “do not open until Dec. 22.”
| veeam @rbrambley Veeam does not comment on speculation or rumorsvr, dec 19 15:16:54 from digsby in reply to rbrambley
|
Tuesday, December 16. 2008
VKernel Capacity Analyzer 3.0 Now Identifies Bottlenecks Down to the VM
 Vkernel just released our Capacity Analyzer 3.0. In addition to showing you bottlenecks in hosts, clusters, and resource pools, they can now show you bottlenecks in VMs -- both inside and outside of VMs. Even small environments have hundreds of VMs, causing ongoing monitoring and finding problems in each individual VM to be very time consuming. Capacity Analyzer 3.0 sorts through them to show you the most problematic VMs first, so you can quickly see which VMs are having current performance problems. With predictive analytics, they also identify which VMs will have performance problems and when, so that you can take necessary proactive measures.
Friday, December 12. 2008
Holiday gift from Veeam
Veeam will be unveiling a new free tool is on Dec. 22 – everyone who registers will automatically receive a download link that day via e-mail. This holiday gift is marked “do not open until Dec. 22.”
Tuesday, December 9. 2008
nworks SPI provides access to 300 VMware-specific metrics
Saturday, December 6. 2008
Replicatetech’s RDA version 1.1 | much easier to setup
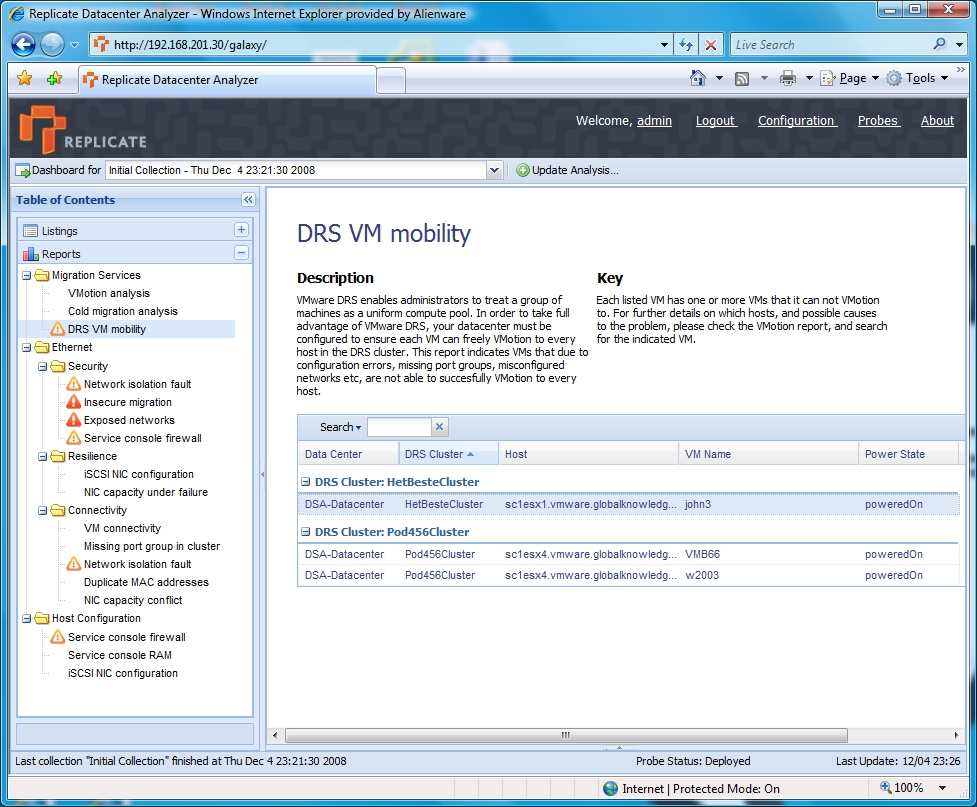 Last week I delivered a VMware Deploy Secure and Analyze course at the Global Knowledge training facilities in Nieuwegein ( 4.8 - 4.8 ) :-). At the end of the week I rolled out Replicatetech’s RDA version 1.1. This new version of the Datacenter Analyzer includes over 20 new features and enhancements, including:
• Easy wizard based setup - get up and running even faster!
• Larger scale support - RDA now supports much larger deployments.
• Highly detailed diagnostic analysis, helping you find and fix problems more quickly.
• Full support for ESXi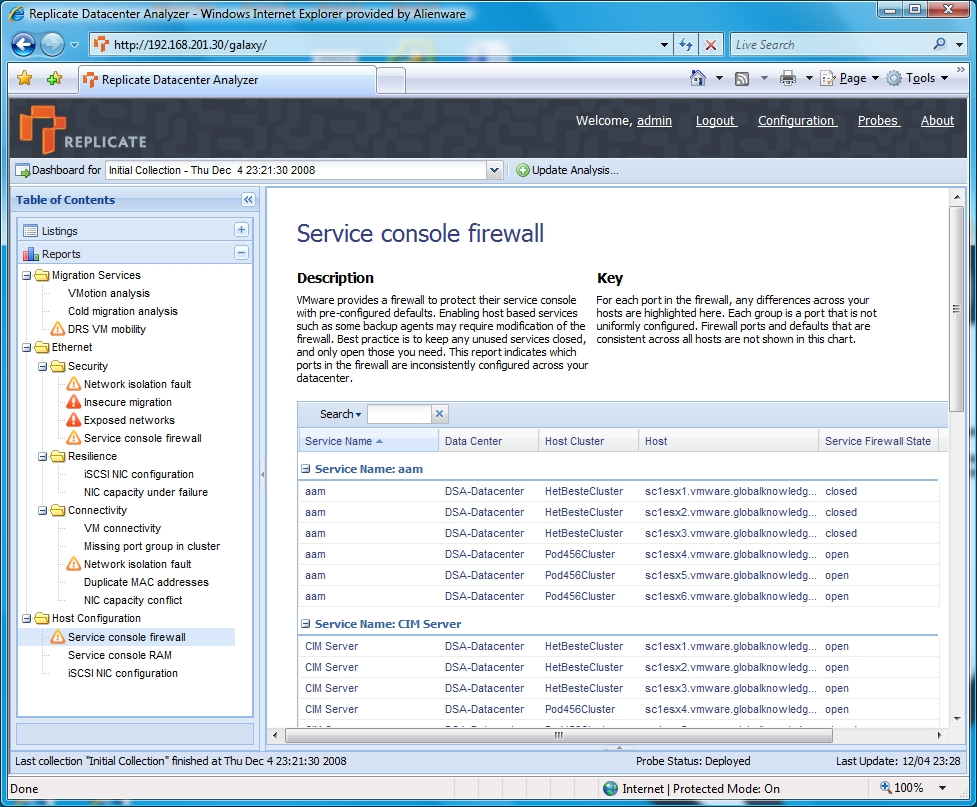
The wizard is a real improvement, just walk through the steps and you’re up and running before you know it. I analyzed 6 ESX 3.5 servers managed by one vCenter server. While the students were checking their environment, I took the opportunity to make some screenshot’s. Just click the picture to enlarge.
 (Page 31 of 34, totaling 337 entries)